Categories
Research

Inferring Aerodynamic Loads from Deformation Data

Researchers

Karen Willcox – Professor and Director of the Oden Institute for Computational Engineering and Sciences

Patrick Blonigan, Senior Member of the Technical Staff, Sandia National Labs

Julie Pham – Graduate Research Assistant

Solving the inverse problem with Scientific Machine Learning (SciML)

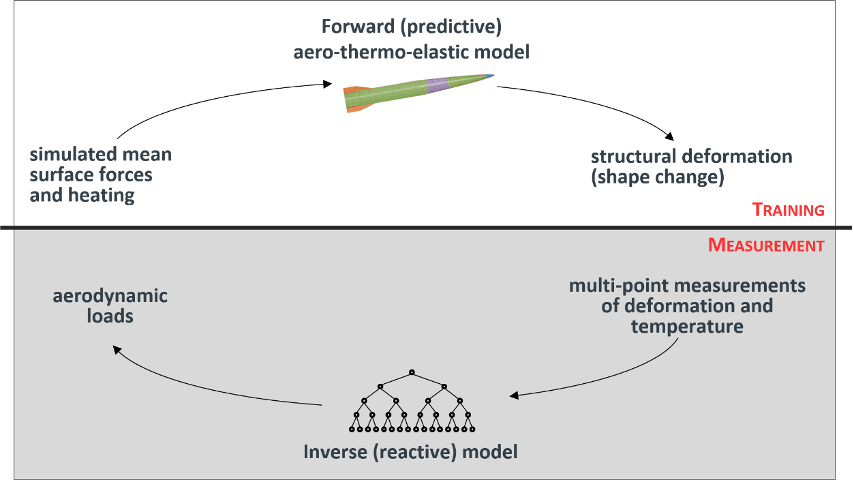
The FAST methodology relies on Scientific Machine Learning (SciML) and a high-fidelity model of the vehicle structural response to produce an inverse map that can rapidly predict aerodynamic loads. The task of inferring aerodynamic loads from measurements of structural deformation is characteristically defined as an inverse problem. Inverse problems are typically computationally expensive and require a significant amount of time to solve. However, the FAST sensing technique requires a rapid evaluation of the inverse solution so that the inferred quantities of interest (QoIs) can inform the guidance and control system of the hypersonic vehicle in real-time. For real-time tractability, we aim to use scientific machine learning (SciML) to train an inverse map that can rapidly predict aerodynamic QoIs from on-board measurements of structural deformation.

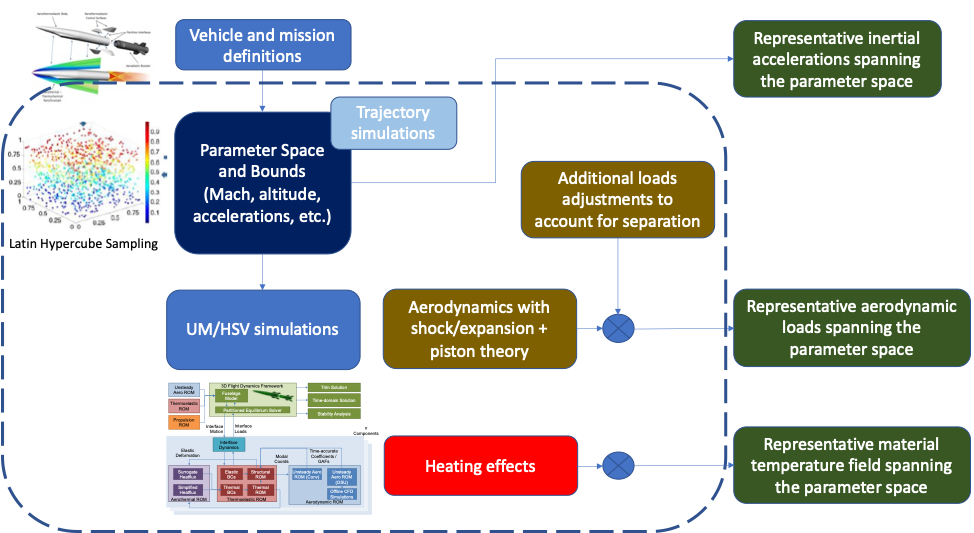
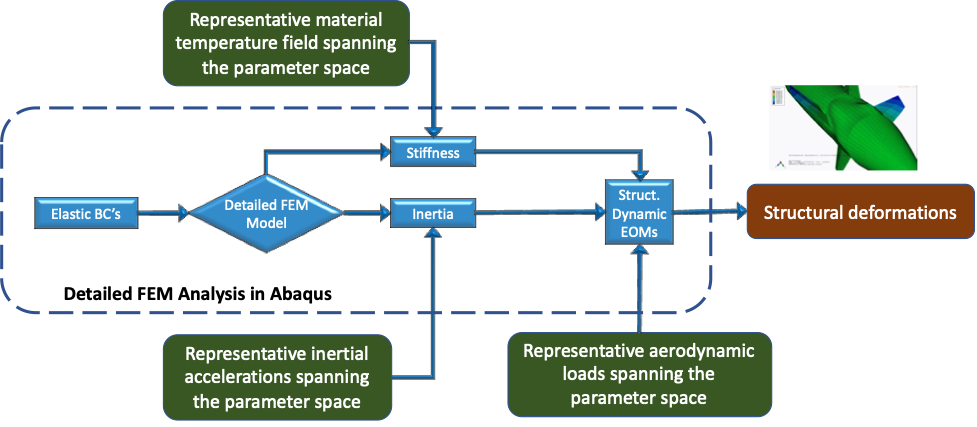
As shown in the figure below, using SciML to develop the inverse map requires significant amounts of training data. To produce the necessary training data, we employ multi-physics and multi-fidelity models to produce forward simulation snapshots over a range of hypersonic flight conditions. The inputs to the forward model are parameterizations of distributed aerodynamic loads, and the outputs are the measurements of structural deformation. To increase robustness to the noisy nature of the measurements, the training dataset is augmented by adding synthetic noise realizations to the snapshots. With a large training set of physics-informed training samples, machine learning algorithms can be used to learn the inverse map from measurements to QoIs.

A physics-based forward model provides predictions of surface deformations, aerodynamic loads and thermal loads given vehicle state. We train a machine learning classifier to represent the inverse map: given surface deformation sensor data and thermal load sensor data, estimate the aerodynamic loads.

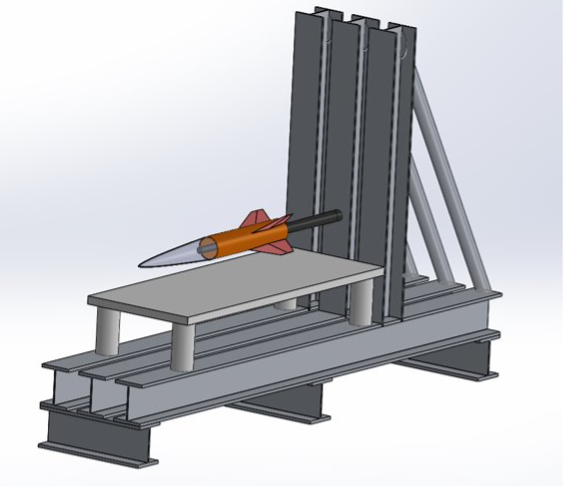
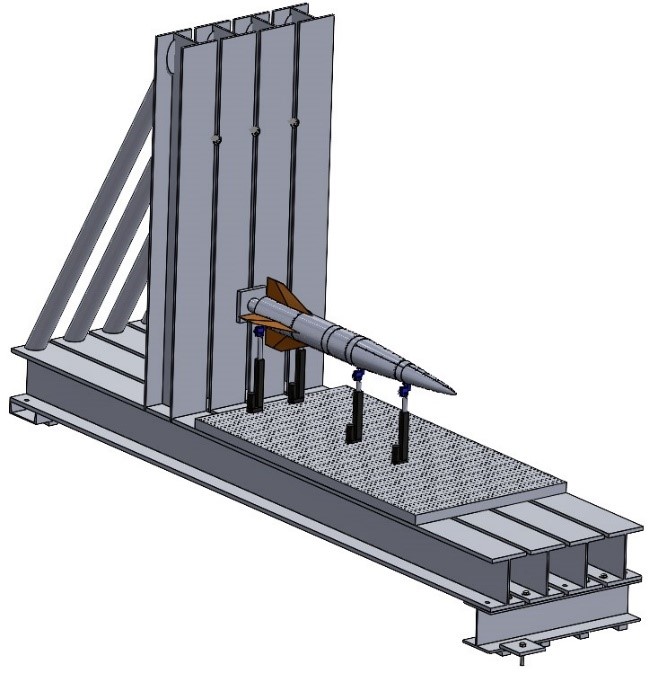
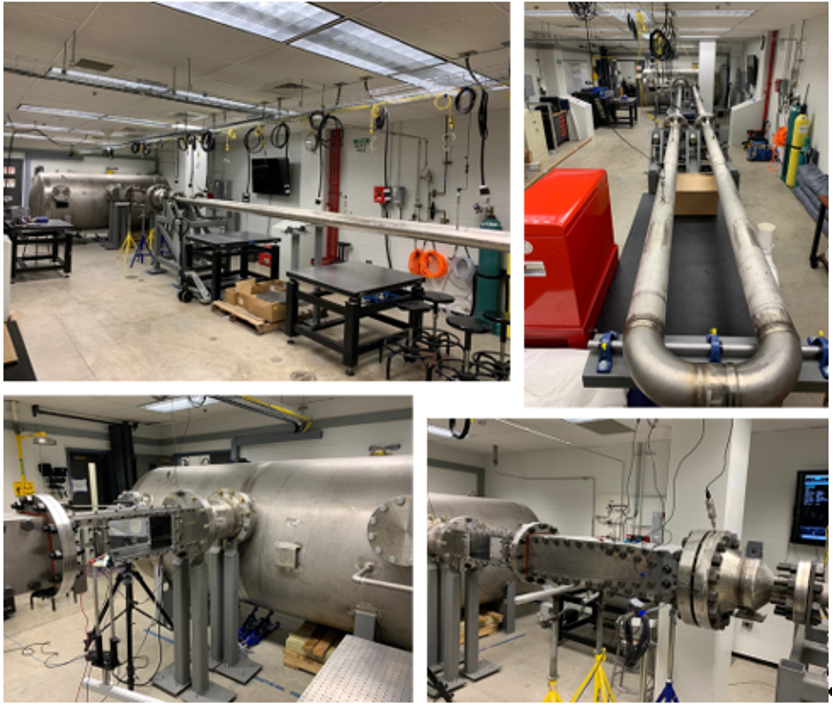
Many of the open questions involve sensor requirements, QoI parameterizations, aerothermoelastic modeling methods, and machine learning methods that can achieve a well-posed, robust, and computationally fast inverse mapping. The results will be validated using benchtop and wind tunnel experiments. Successful development of this strategy will make the FAST technique a novel advancement in the predictive capabilities for hypersonics. 


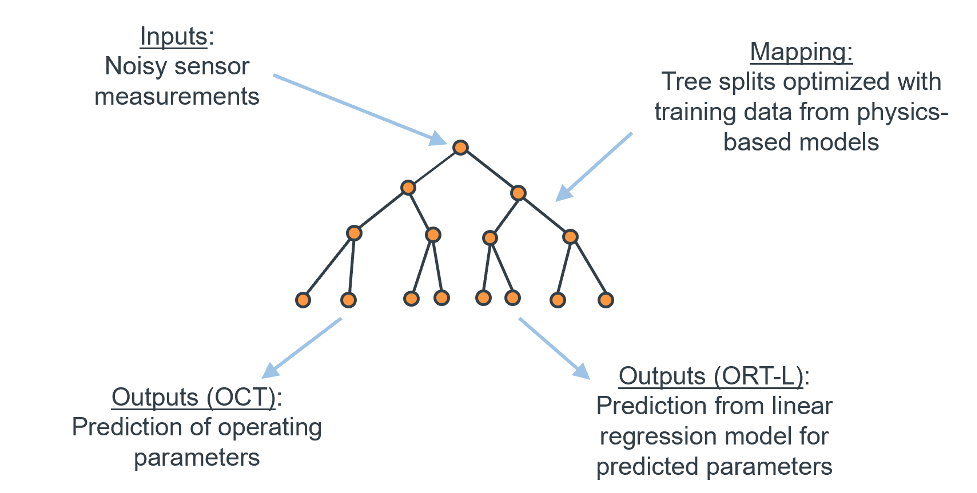
SciML framework using optimal classification trees (OCT) and/or optimal regression trees with linear models (ORT-L) to predict quantities of interest
Categories
Research

Thermoelastic Framework for FAST Training Data Generation

Researchers

Carlos E. S. Cesnik – Clarence L. (Kelly) Johnson Professor of Aerospace Engineering, University of Michigan

Michael Jones – Graduate Student Research Assistant, University of Michigan

Ana C. Meinicke – Graduate Student Research Assistant, University of Michigan

Solving the inverse problem with Scientific Machine Learning requires data to train its algorithms. Our goal is to determine the best way to obtain the required training data for the entire flight envelope in a timely manner and with the appropriate level of fidelity.

The training data for this problem will relate the temperature and structural deformation to the aerodynamic loading distribution, the inertial loading, and aeroheating. The aerothermoelastic solution used to calculate the temperature, deformation, and loading distributions will be developed here and will take advantage of the University of Michigan’s High-Speed Vehicle (UM/HSV) framework, a multi-physics, multi-fidelity simulation framework, and the finite element solver Abaqus. The UM/HSV (Klock & Cesnik, 2014) integrates aero-thermo-elastic-propulsive models to simulate a high-speed vehicle through its trajectory. With it, one can conduct stability analysis, flight trimming, dynamic simulation, and closed-loop control evaluation. It takes advantage of engineering and reduced-order models to capture the various effects impacting the flight of the vehicle as seen illustrated in Figure 1.

The aerothermoelastic modeling is conducted under the assumption that the highest fidelity model possible is not required to generate the appropriate excitation loads for the detailed thermal and elastic training data. Simplified loading distribution estimations are acceptable if they are representative of the solutions and spans the loading distribution space of interest. One of the major goals of our research is to determine the importance of loading model accuracy to the FAST methodology. The loading distribution space will be defined based on numerical and experimental test cases. The numerical  model is the IC3X vehicle developed by the AFRL Munitions Directorate (Witeof, Z. D., and Neergaard, 2014) and modified by the University of Michigan.  Also, derivatives of this model will be developed for the experimental efforts under FAST, and these will also be modeled and simulated in our new framework so SciML models can be created and validated with the experiments.

Aerodynamic loadings over the vehicle surface, temperature distribution throughout the structure, and inertial loadings will be used to excite the corresponding structural deformation. Cruise altitude, Mach number, angle of attack, sideslip angle and fin deflections will be varied and sampled using Latin Hypercube Sampling to determine the loading distributions. These approximated loading cases will be fed into the high-fidelity thermoelastic model developed for Abaqus FEM as shown in Figure 2. The corresponding temperature and deformation outputs along with the input loading distributions will then be used to train the machine learning algorithms. Since it is impractical to assume that temperature and elastic deformation are known in many points of the vehicle, we will also investigate the optimal sensor locations to best observe the aerodynamic loads on the vehicle.

Figure 1. Training Load Distribution Generation

Figure 2. Structural Deformation Calculation using Abaqus

Klock, R. J., & Cesnik, C. E. S. (2014). Aerothermoelastic Simulation of Air-Breathing Hypersonic Vehicles. AIAA Science and Technology Forum and Exposition (SciTech2014), National Harbor, Maryland, 13—17 January.

Witeof, Z. D., and Neergaard, L. J. (2014). Initial Concept 3.0 Finite Element Model Definition. In Report AFRL-RWWV-TN-2014-0013 (Issue Eglin Air Force Base: Air Force Research Laboratory).

Categories
Research

Experimental Validation: Benchtop and Mach 5 Windtunnel

The FAST methodology will be validated by measuring the structural response to known surface loads applied to 3D printed models of a generic hypersonic vehicle. Models will be tested in a no-flow “benchtop” configuration and in the UT Austin Mach 5 Wind Tunnel. Related wind tunnel measurements will be made in UTSA’s Mach 7 Ludwieg Tube. The structural response (deformation) will be determined using multi-point strain measurements. The FAST methodology will take as input the strain measurements and it will predict the loads, which can be compared to the actual loads.

Researchers:

Noel Clemens – Professor

Jayant Sirohi — Professor

Marc Eitner – Post-doctoral fellow

Brianna Blocher – Graduate research assistant

Ben Diaz – Graduate fellow

Aditya Panigrahi – Graduate research assistant

Brandon Cruz – Undergraduate research assistant

Experimental validation data will be acquired by testing two different models that are based on the outer mold line of the IC3X reference hypersonic vehicle. The models will be a benchtop configuration with no flow, and a wind tunnel model. The benchtop model is designated as IC3X-B to differentiate it from the actual IC3X. The benchtop model is 5 feet in length (40% scale), is made of a single material (plastic or metal), and has an internal structure that was designed specifically to meet the needs of this project. The benchtop model will be subjected to a variety of known structural and thermal loads in the absence of flow, and the resulting deformation will be measured. The wind tunnel model will be 1 ft long, 3D printed from a plastic or elastomer, and is designated as the IC3X-W. Both models will be fitted with a 6 degree-of-freedom force balance to enable measurements of three orthogonal forces and three moments. The models will also be instrumented with a large number of strain and thermal sensors as detailed below.

All experiments are performed at the J.J. Pickle Research Campus of The University of Texas at Austin. The benchtop model is attached to the rigid test stand as shown in the accompanying figure. The sting-based 6-DOF force-balance is fixed on one end to the test stand and the model is attached near its center of gravity to the other end. We impose known loads to the model and then measure its deformation with strain sensors. The loads are applied by using four linear actuators, each of which is connected to the model via a uniaxial load cell.

Benchtop model of IC3X.

The application of the loads is controlled via a LabView program. A load command is given within the program, which is then sent to a Microcontroller and two PWM motor controllers. The data from the four load cells is read through a National Instruments PXIe DAQ system and serves as the feedback variables.

A fiber optical system is used to obtain local strain and temperature measurements at discrete locations on the inside of the model. A set of four fibers containing eight discrete sensors is used to measure the strain, thus a total of 32 discrete strain measurements can be obtained during each loading case.

The internal structure of the IC3X-B was designed specifically for this project. To access the interior of the model (to attach and maintain sensors), it is made from four separate pieces, which attach to each other using a tapered twist-lock mechanism, as shown in the figure below. In addition, multiple sections of the wall are reduced in thickness to produce points of flexure. These local flexures lead to large strain values during static loading and offer excellent locations for attachment of the strain sensors, due to the expected high signal to noise ratio.

IC3X-B in separate pieces and assembled.

The benchtop model is fabricated in house using additive manufacturing (3D printing). In-house manufacturing allows rapid design iterations and enables the use of materials with sufficiently low Young’s modulus.

The IC3X-W is a 1 ft long (8% scale) model that is designed to be tested in the Mach 5 wind tunnel. Its internal structure will be mostly identical to that of the larger benchtop model. The fabrication of this model is challenging, as the small dimensions approach the limitations of the additive manufacturing method.

IC3X-W mounted on the sting/strut.

The stiffness of the wind tunnel model (material choice and wall thickness) is based on numerical simulations, which model the structural deformation resulting from flow-induced pressure. The simulations are performed in ANSYS Fluent and ANSYS Mechanical and account for viscous flow effects and structural non-linearities. This model will also be instrumented with fiber optical sensors to obtain strain and temperature measurements on the inside wall. In addition to these discrete sensors, the outside of the model will be measured using pressure sensitive paint and stereoscopic digital image correlation, which obtains distributed surface pressure and strain information.

CFD solution of the flow around the IC3X-W in the Mach 5 wind tunnel.
Categories
Research

Experimental Validation: Mach 7 Ludwieg Tube

UT San Antonio, under the direction of Prof. Chris Combs, will conduct experimental validation studies in their newly constructed Mach 7 Ludwieg tube. The Ludwieg tube is an intermittent-flow facility that produces Mach 7 flow for a duration of 50 to 100 milliseconds. Aeroelastic models will be mounted in the test section and simultaneous measurements of internal strain and surface pressure will be made. In some cases, the aeroelastic model will be mounted on a sting balance to measure integrated aerodynamic forces and moments. The transducer measurements will be supplemented with field measurements such as pressure sensitive paint and digital image correlation. The UTSA Ludwieg tube is described in detail below. The Ludwieg tube will complement related studies that will be made in UT Austin’s Mach 5 wind tunnel.     

UTSA Hypersonic Ludwieg Tube

Figure 1. Schematic of the UTSA Mach 7 Ludwieg Tube.

UTSA has recently completed construction of a new Mach 7.2 hypersonic Ludwieg tube facility. After roughly three years in development the facility—designed by PI Combs—is now fully operational. The UTSA Hypersonic Ludwieg tube has a constant test section cross-section of 203 mm × 203 mm (8” × 8”). The driver tube can be pressurized using either compressed gas bottles or a four-stage compressor—depending on the desired gas composition—providing stagnation pressures up to approximately 14 MPa. While it is anticipated that the primary test gas will be air for the duration of this program, it is possible to test with nitrogen or other more exotic test gases depending on the needs of a given experimental campaign. With an 18-m-long folded driver tube, individual test runs have a steady-state duration of roughly 50-100 ms depending on initial conditions. The insulated driver tube pipe can be pre-heated up to 700 K for wind tunnel tests. The freestream velocity is on average 1130 m/s, resulting in freestream Reynolds numbers between 0.5-200 × 106 m-1, making the UTSA facility one of the few at a U.S. university capable of accessing this Reynolds and Mach number range. The flow is exhausted into a roughly 6 m3 vacuum dump tank, enabling multiple steady-state passes of hypersonic flow for total test times up to 500 ms. Optical access for potential experiments can be provided by modular glass windows on the wind tunnel sidewalls, floor, and ceiling. While the facility run duration is relatively short compared to blowdown facilities, the steady test time correlates to over 1500 flow lengths for an appropriately scaled test model.

Figure 2.  UTSA Mach 7 Ludwieg tube facility.